Marine Heatwaves in the PNW
The increasing frequency of severe marine heatwaves poses a serious threat to marine life. Experimental exposures that test physiological tolerance limits can identify vulnerable taxa, but useful experiments require a robust characterization of regional heatwave dynamics. I originally conducted this analysis in December 2019 in advance of my 2020 winter experiments on Pacific herring early life-stages. I analyzed an 18-year NERRS dataset from the Ploeg Monitoring Station in Padilla Bay, WA. The station is situated within a large sea grass system and is representative of typical herring spawning habitat (48°33’22.8”N 122°31’51.2”W).
I used the R package HeatwaveR to detect heatwave events as defined by Hobday et al. (2016); an anomalous event that lasts for five or more days with temperatures warmer than the 90th percentile of a long-term seasonal climatology. The authors recommend a minimum 30-year dataset to fully capture decadal climate oscillations. The 18-year dataset from Padilla Bay falls short, so the interpretation of this analysis is somewhat limited, but still useful for informing experimental designs. HeatwaverR evaluated daily mean temperatures from 2002-2019 (dataset deposited here, station code PDBBPWQ).
###install and load packages
#install.packages("heatwaveR")
library(heatwaveR)
library(dplyr)
library(tidyverse)
library(readxl)
library(openxlsx)

###load dataset
setwd("C:/Users/Christopher Murray/Documents/GitHub/Fish-Ecophysiology/Heatwave Analysis")
data = read_xlsx("PadBay.xlsx")

data$t<- convertToDate(data$t)

###Detect events
ts = ts2clm(data, climatologyPeriod = c("2002-1-01","2019-12-31"), pctile = 90)
mhw = detect_event(ts)
###View metrics
mhw$event %>%
  dplyr::ungroup() %>%
  dplyr::select(event_no, duration, date_start, date_peak, intensity_max, intensity_cumulative, rate_onset) %>%
  dplyr::arrange(-intensity_max) %>%
  head(5)

mhw = lolli_plot(mhw, metric = "intensity_max")
mhw
This lolli_plot shows all 45 events that met the heatwave criteria (Heatwave Events). The most severe events occured in spring and summer but heatwaves were detected in all seasons (winter 10, spring 12, summer 13, fall 10). Note the cluster of events following the 2013–2015 extreme warm anomaly of the northeastern Pacific (the blob event).
Padilla Bay, WA Heatwaves 1992-2019
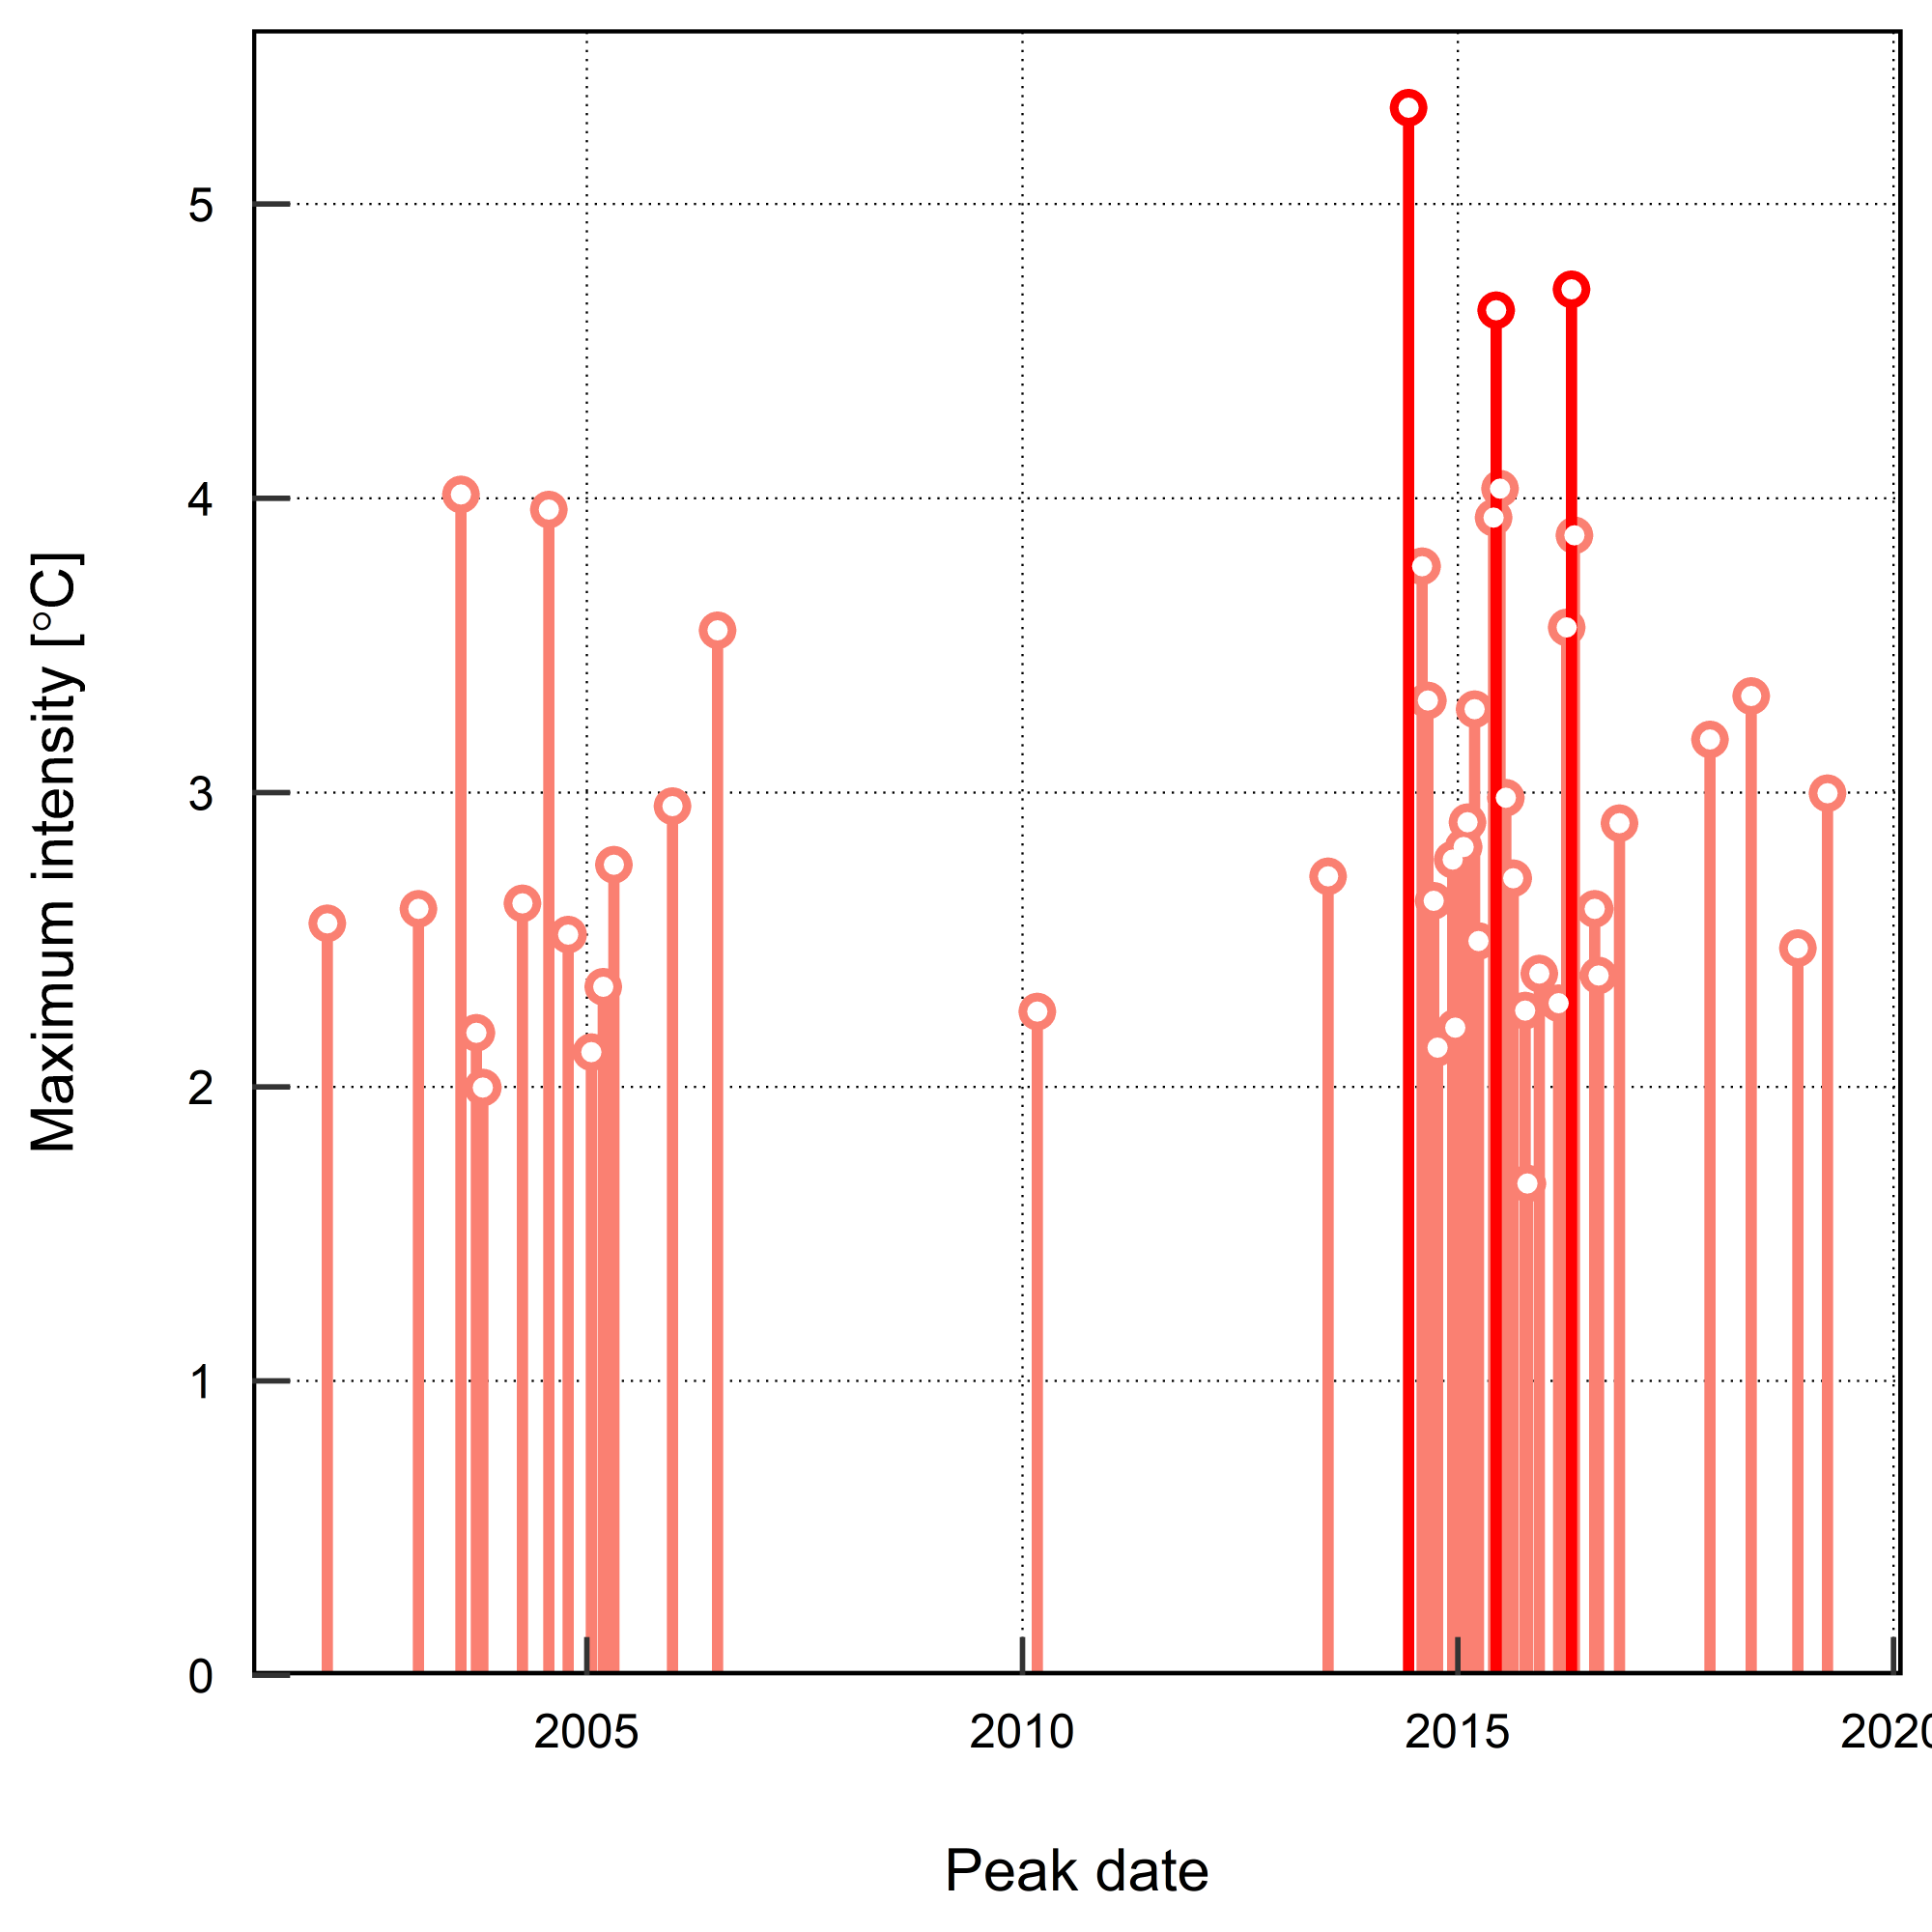
The function outputs a table of summarizing the top five events of the period (avg. duration: 7.2 d; avg. intensity: 4.5°C; avg. rate of onset: 0.6°C/d)
| event_no | duration | date_start | date_peak | intensity_max | intensity_cumulative | rate_onset |
|---|---|---|---|---|---|---|
| 1 | 8 | 2014-06-03 | 2014-06-08 | 5.33 | 30.8 | 0.564 |
| 2 | 5 | 2016-04-19 | 2016-04-22 | 4.71 | 17.2 | 0.669 |
| 3 | 6 | 2015-06-08 | 2015-06-11 | 4.64 | 21.2 | 0.649 |
| 4 | 10 | 2015-06-23 | 2015-06-26 | 4.03 | 34.2 | 0.327 |
| 5 | 7 | 2003-07-20 | 2003-07-23 | 4.01 | 18.9 | 0.607 |
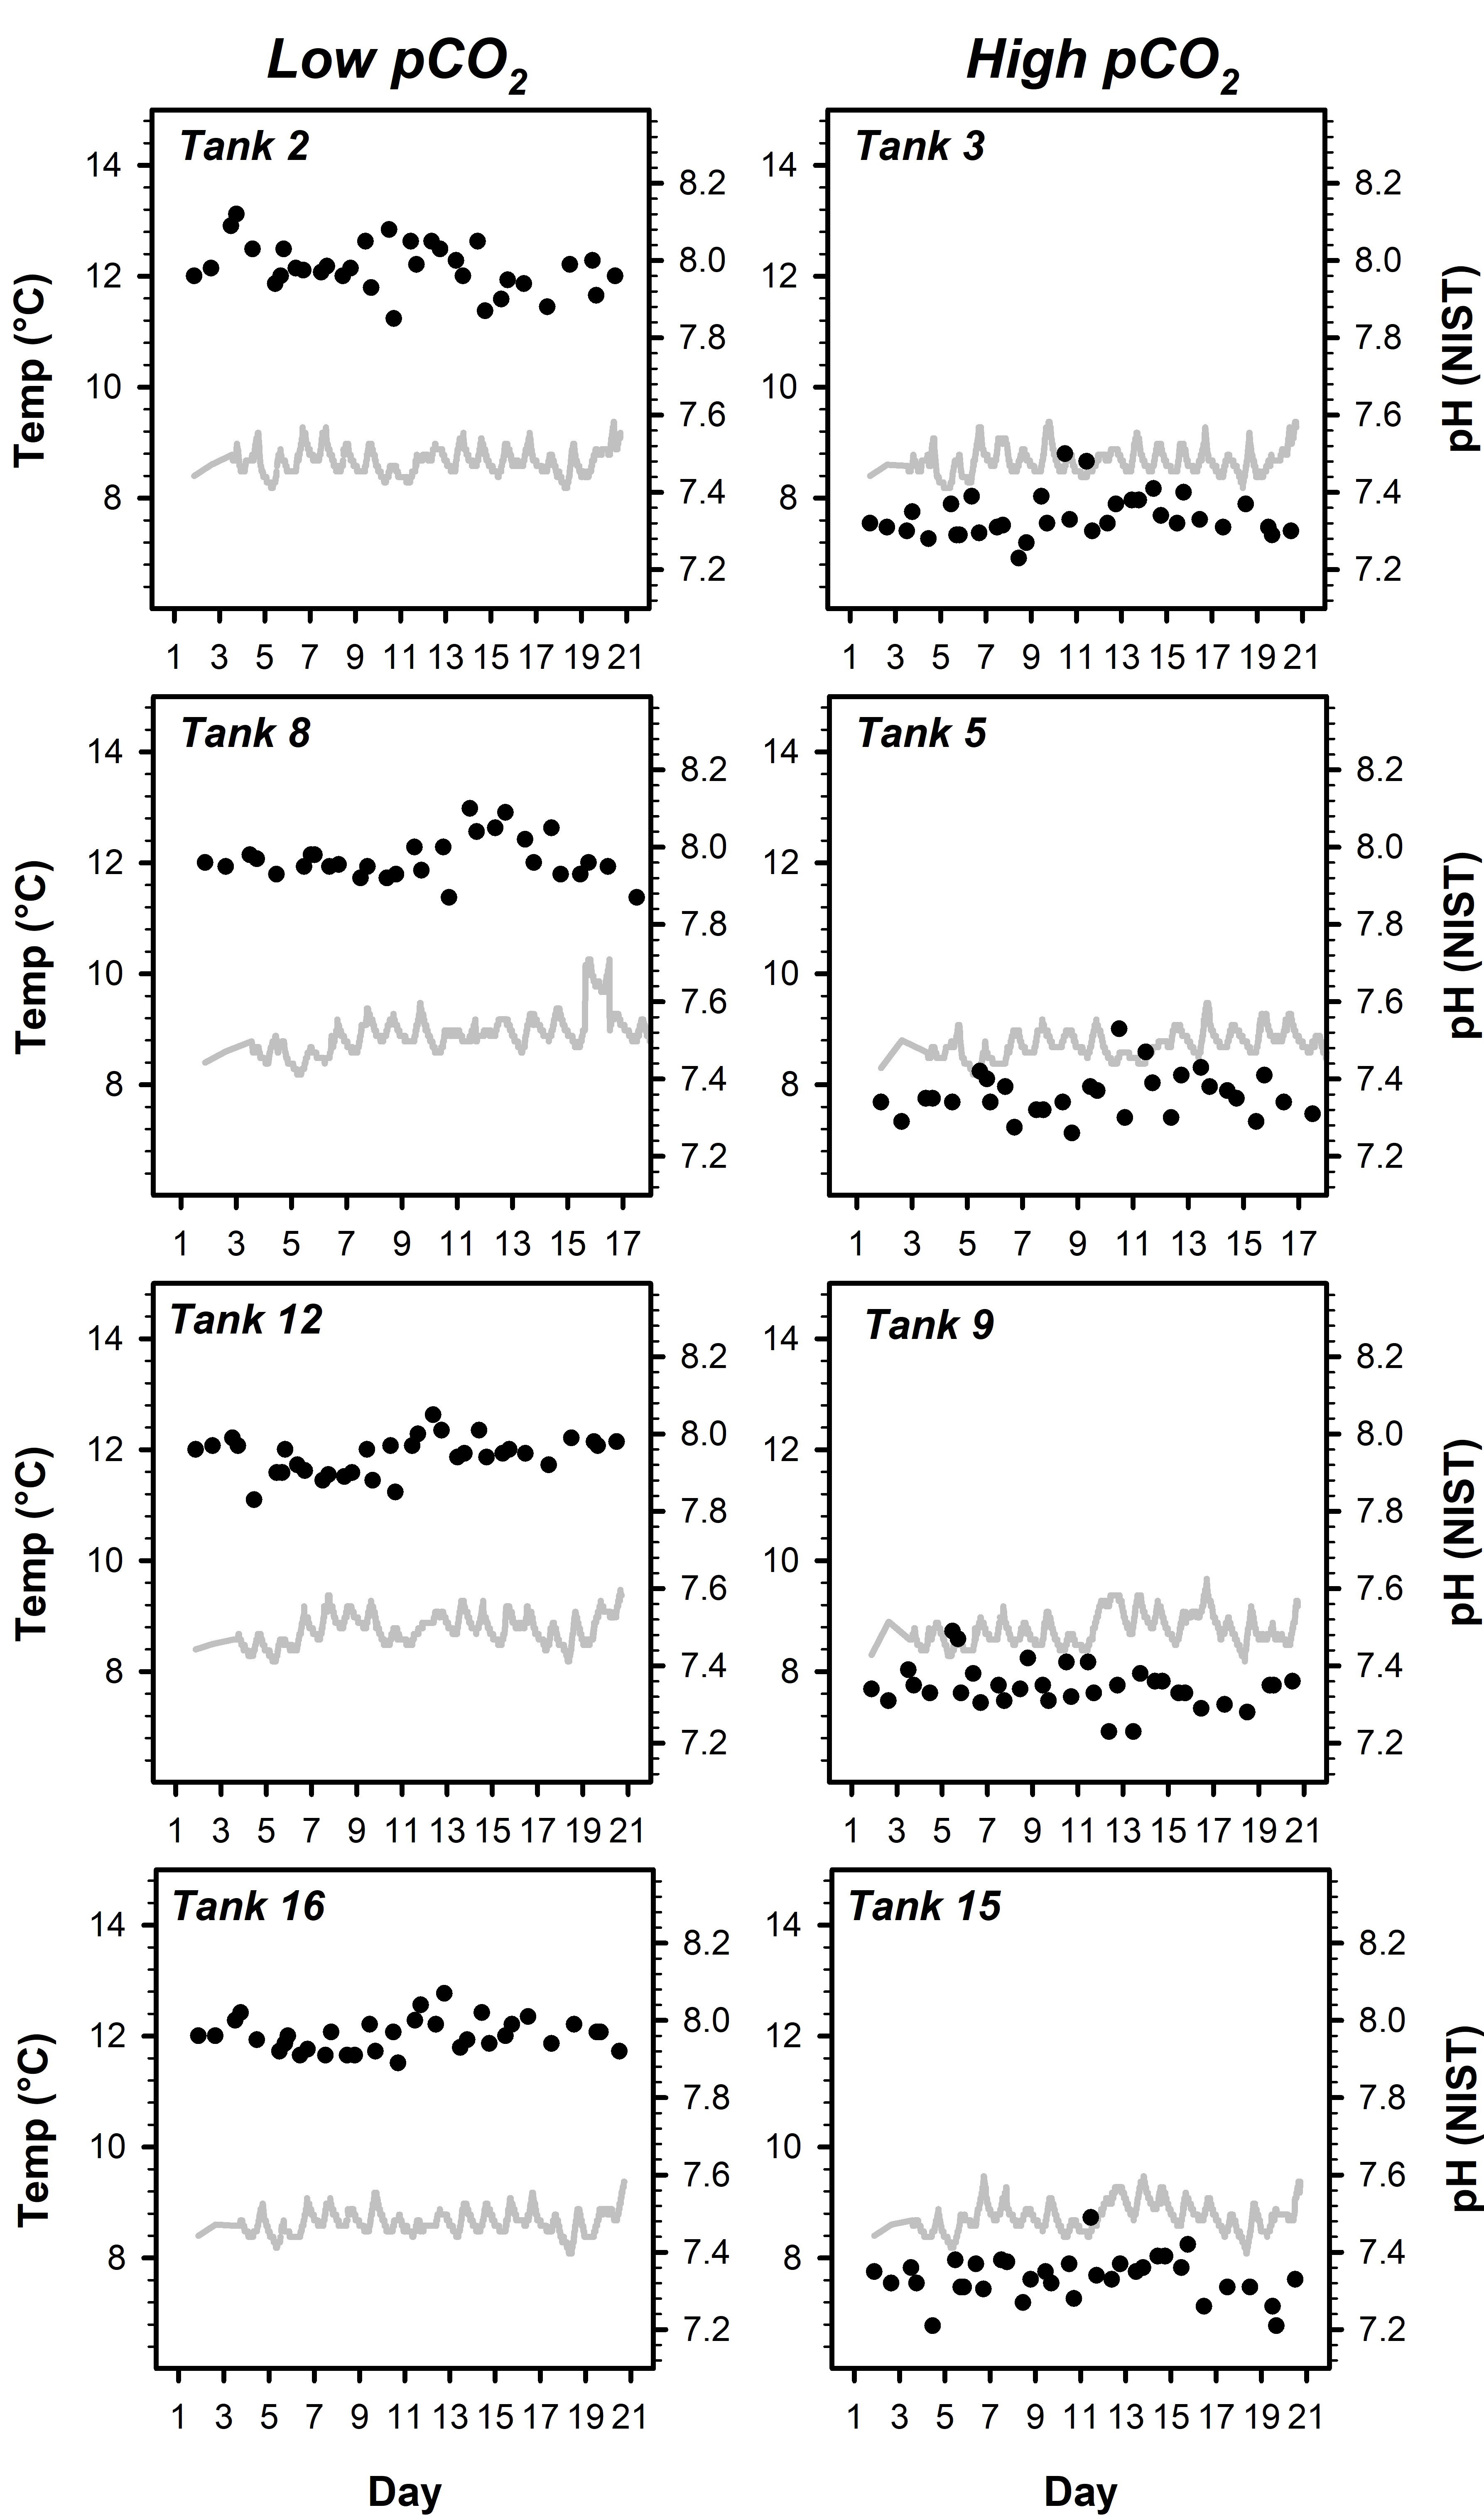
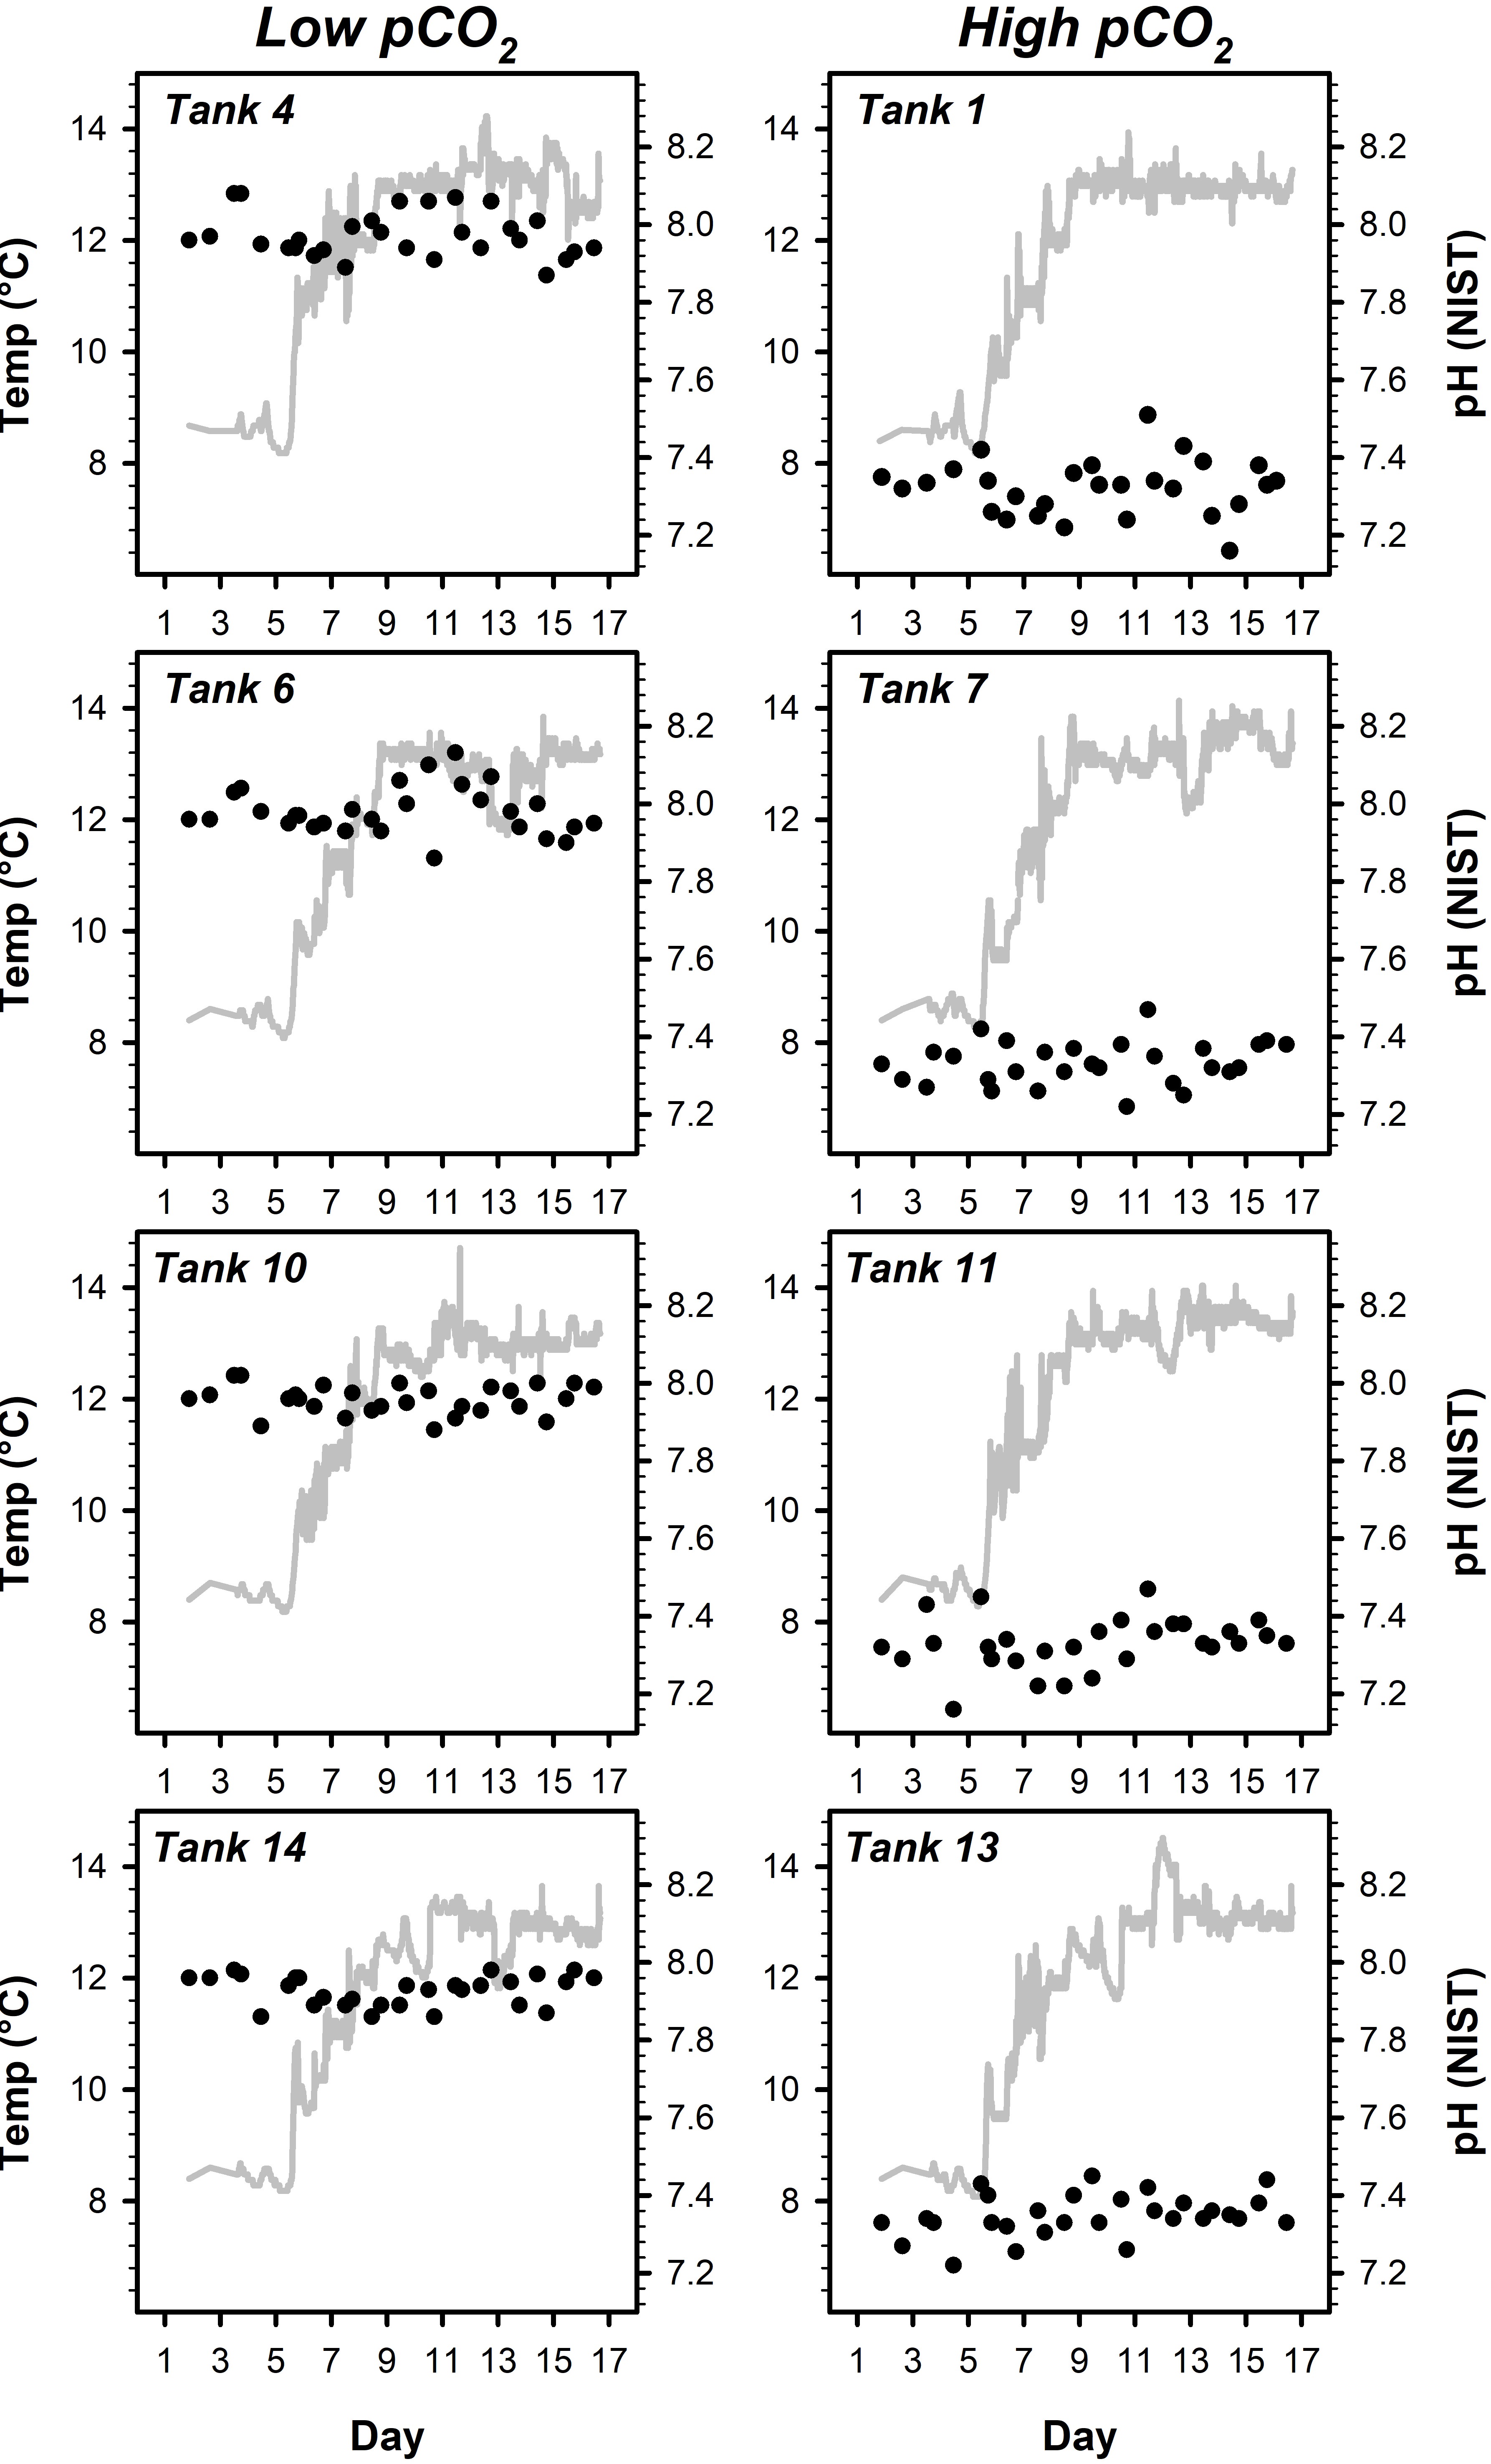
I designed my experimental heatwave simulation based on these extreme events. Herring embryos were reared under two pCO2 treatments (low pCO2: ~600 µatm, pHT 7.85; elevated pCO2: ~2650 µatm, pHT 7.23) at common temperature conditions (~8.5°C) for the first 5 days post-fertilization (dpf). On day 5, the simulated heatwave was initaited in half of the rearing units per pCO2 level. Temperatures were increased by ~0.9°C/d for 5 consecutive days to achieve +4.4°C above ambient (8.7°C to 13.1°C). The somewhat elevated rate of increase was a limitation of coarse temperature control of my aquarium thermostats and heaters.
These figure illustarte pH and temperature conditions from 16 experimental rearing units (black dots are discrete pH measurements and grey lines are continuous temp data):
| Ambient Temps | Heatwave Treatments |
|---|---|
 |
 |