I sent 16 larvae (one per replicare tank) to UW’s Functional Genomics Core for a pilot RNA extraction and QC. The extraction was completed by Dr. Sengkeo Srinouanprachanh on 7/2/2020.
RNA extracted using Zymo RNA Mini Kit. QC was completed using Eukaryote Total RNA Pico assay in a Agilent 2100 bioanalyzer.
RNA quality varied between samples. See the electropherograms below:
Replicates 1-8
Replicates 9-16
A conservative cutoff for RIN is ~7, although samples with slightly lowers RINs could be controlled for during analysis. We found that 10/16 samples had RINs > 7, 3 samples > 6, and 3 samples < 6.
Next Steps
I have ~15 more samples per replicate tank preserved in RNAlater. Based on the images I took of the pilot larvae pre QC, evidence for visual degradation is a reltively good marker for RNA quality. I’m optomistic that there are a few winners from each replicate vial to progress with a high quality analysis.
A note on RIN values
RIN is an algorithm based on a selection of features (Schroeder et al., 2006). Important qualities include (from Schroeder et al.)
- The total RNA ratio measures the fraction of the area in the region of 18S and 28S compared to the total area under the curve and reflects the proportion of large molecules compared to smaller ones. It has large values for categories 6 to 10.
- The height of the 28S peak contributes additional information about the state of the degradation process, i.e. during degradation, the 28S band disappears faster than the 18S band. Therefore, it allows detection of a beginning degradation. It has largest values for categories 9 and 10, and zero values for categories 1 to 3.
- The fast area ratio reflects how far the degradation proceeded and has typically larger values for the categories 3 to 6.
- The marker height has large values for categories 1 and 2 and small values for all other categories since short degradation products will overlap with the lower marker.
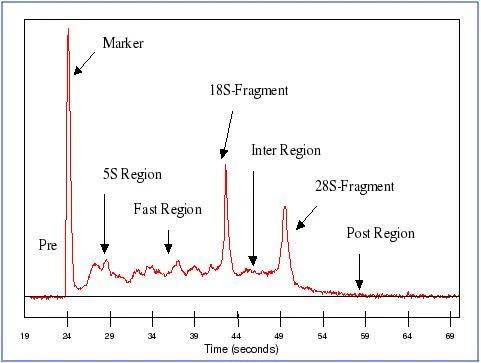
Segments of an electropherogram

Feature extraction. Segments of an electropherogram: The segment preceeding the lower marker is designated the pre-region. The marker-region coincides with the area occupied by the lower-marker peak. The 5S-region covers the small rRNA fragments (5S and 5.8S rRNA, and tRNA). The 18S-region and 28S-region cover the 18S peak and 28S peak, respectively. The fast-region lies between the 5S-region and the 18S-region. The inter-region lies between the 18S-region and the 28S-region. The precursor-region covers the pre-cursor RNA following the 28S-region. And finally the post-region lies beyond the precursor-region.
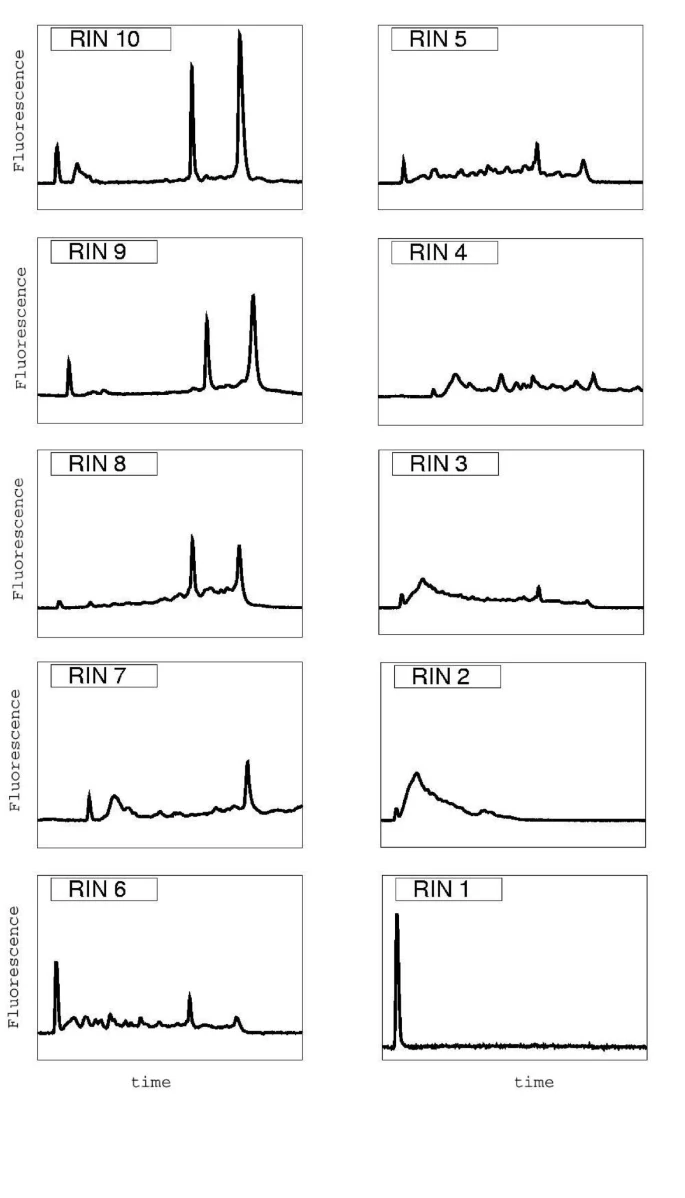
Here are the characteristics of the 10 RIN categories.
RNA integrity categories

Fig. 2: The figure shows typical representatives of the ten integrity categories. RIN values range from 10 (intact) to 1 (totally degraded). The gradual degradation of rRNA is reflected by a continuous shift towards shorter fragment sizes.
Work Cited
Schroeder A, Mueller O, Stocker S, Salowsky R, Leiber M, Gassmann M, Lightfoot S, Menzel W, Granzow M, Ragg T (2006) The rin: An rna integrity number for assigning integrity values to rna measurements. BMC Molecular Biology 7: 3